|
2.R&D Activities |
|
2 -1
|
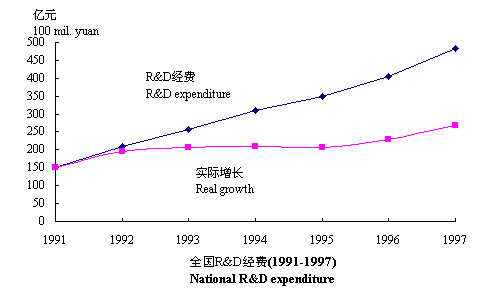
全国R&D经费(1991~1997)
National R&D expenditure |
|
| |
1991 |
1992 |
1993 |
1994 |
1995 |
1996 |
1997 |
|
R&D 经费
R&D expenditure |
150.8 |
209.8 |
256.2 |
309.8 |
349.1 |
404.8 |
481.9 |
比上年实际增长(%)*
Real growth (%)
|
— |
29.0 |
6.6 |
0.6 |
- 0.2 |
9.5 |
17.6 |
R&D 经费/国内生产总值(%)
GERD/GDP (%)
|
0.7 |
0.8 |
0.7 |
0.7 |
0.6 |
0.6 |
0.6 |
*按GDP的缩减指数计算
Calculated by GDP deflator
注:本手册的科技或研究与发展活动的人员与经费数据除包括政府部门属研究与发展机构、大中型工业企业、高等学校外,还包括建筑业、运输邮电业、农业和地质水利业企事业单位的有关数据。
Note: Data on expenditures on and personnel engaged in S&T or R&D activities in this book include those of enterprises or institutions of construction, transportation, post and communications, agriculture, geology and water conservancy industry, as well as R&D institutions subordinated to government departments, large and medium-sized enterprises and institutions of higher learning.

2-2
|
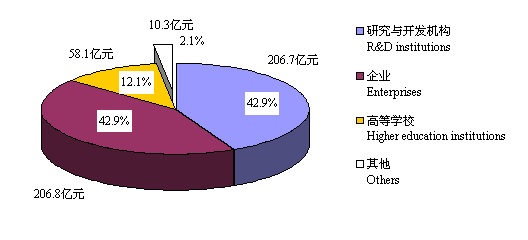
全国R&D经费按执行部门分类(1997)
National R&D expenditure by sector(in 100 mil. yuan) |
|

2-3
|
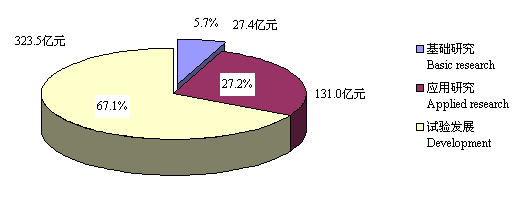
全国R&D经费按活动类型分类(1997)
National R&D expenditure by character of work (in 100 mil. Yuan) |

2-4
|
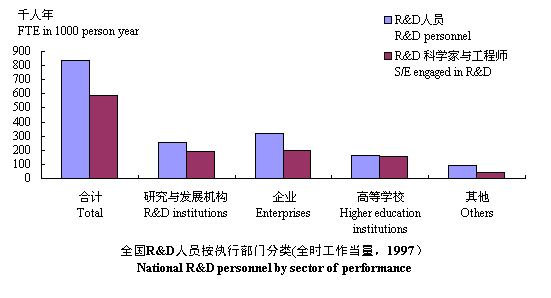
全国R&D人员按执行部门分类(1997)
National R&D personnel by sector |
|
|
全时工作当量,千人年 FTE in 1000 person·year |
| |
R&D 人员
R&D personnel |
|
科学家和工程师
S/E |
全国
Total |
834.4 |
590.6 |
|
|
255.3 |
193.1 |
|
|
321.7 |
198.5 |
高等学校
Higher education institutions
|
165.8 |
156.9 |
|
|
91.6 |
42.1 |

|
2 -5
|
部分国家R&D经费
R&D expenditure in selected countries |
|
|
10亿本国货币单位 Billion of national currency |
| |
中国China
1997 |
美国USA
1996 |
日本
Japan
1995 |
德国
German
1996 |
法国
France
1996 |
英国
UK
1995 |
俄罗斯Russia
1996 |
韩国
ROK
1995 |
巴西
Brazil
1995 |
|
R&D 经费
R&D expenditure |
48.2 |
184.7 |
14408.2 |
80.7 |
182.2 |
14.3 |
19393.9(2) |
9440.6 |
5.96(1) |
|
R&D/GDP(%) |
0.64 |
2.52 |
2.98 |
2.28 |
2.31 |
2.05 |
0.86 |
2.68 |
0.88 |
科技经费支出数据,取自巴西国家科技指标1990-1995。
Total S&T expenditure, from Brazil National S&T Indicators 1990-1995.
数据来自《俄罗斯联邦各地区科技指标》。
Source: Russian Federation, S&T in the Regions of the Russian Federation.
数据来源:除中国数据和(1),(2)外,各数据均来自OECD《科学技术统计1997》。
Source: Main S&T Statistics of OECD 1997, except the data on China and (1),(2).
|
2 -6
|
部分国家R&D经费按执行部门分类
R&D expenditure in selected countries by sector of performance |

数据来源:同表2-5。
Source: the same with Table 2-5.
|
2 -7
|
部分国家R&D人员
R&D personnel in selected countries |
|
| |
R&D 人员(全时工作当量,千人年) R&D personnel (FTE in 1000 person·year) |
每万个劳动力中R&D人员
R&D personnel per 10000 labor force |
|
中国 China 1997 |
834.4 |
12 |
|
日本 Japan 1995 |
948.1 |
142 |
|
德国 Germany 1995 |
470.2 |
119 |
|
法国 France 1995 |
318.4 |
125 |
|
英国 UK 1993 |
270.0 |
95 |
|
俄罗斯 Russia 1996 |
990.7 |
136 |
|
韩国 ROK 1995 |
152.2 |
73 |
数据来源:同表2-5。
Source: the same with Table 2-5.
|
|
| |
 |
|

