|
2.R&D Activities |
|
2 -1
|
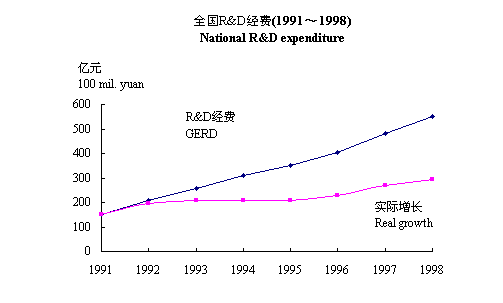
全国R&D经费(1995~1998)
National R&D expenditure |
|
| |
1995 |
1996 |
1997 |
1998 |
|
R&D经费
R&D expenditure |
348.7 |
404.5 |
481.5 |
551.1 |
比上年实际增长(%)*
Real annual growth (%)
|
-0.2 |
9.5 |
17.6 |
10.1 |
R&D经费/国内生产总值(%)GERD/GDP(%)
|
0.60 |
0.60 |
0.64 |
0.69 |
*按GDP的缩减指数计算
Calculated by GDP deflator
2-2
|
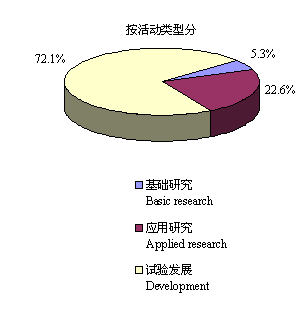
全国R&D经费按执行部门和活动类型分类(1998)
National R&D expenditure by sector of performance and character of work |
|
2-3
|
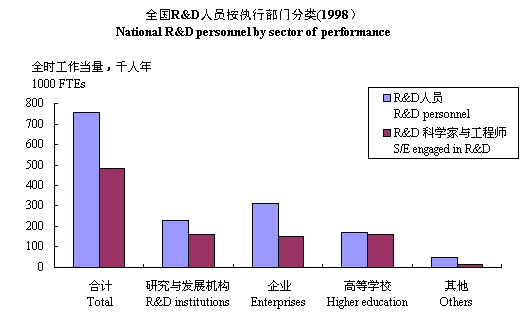
全国R&D人员按执行部门分类(1998)
National R&D expenditure by character of work (in 100 mil. Yuan) |
|
2 -4
|
部分国家R&D经费
R&D expenditure in selected countries |
|
|
10亿本国货币单位 Billion of national currency |
| |
中国China
1998 |
美国USA
1998 |
日本
Japan
1997 |
德国
Germany
1998 |
法国
France
1997 |
英国
UK
1997 |
俄罗斯Russia
1997 |
韩国
ROK
1997 |
印度(1)
India
1995 |
|
R&D经费
R&D expenditure |
55.1 |
227.9 |
14794.0 |
87.5 |
181.8 |
14.7 |
24449.7 |
12185.8 |
68.2 |
|
R&D/GDP(%) |
0.69 |
2.79 |
2.92 |
2.33 |
2.23 |
1.87 |
0.94 |
2.89 |
0.81 |
数据来源:除中国数据和(1)外,各数据均来自OECD《科学技术指标1999/1》。
Source: Main S&T Indicators of OECD 1999/1, except the data on China and (1).
数据来自《印度科学技术手册1995》。
Source: India, Science & Technology pocket data book 1995.
|
2 -5
|
部分国家R&D经费按执行部门分类
R&D expenditure in selected countries by sector of performance |
 数据来源:OECD《科学技术指标1999/1》;《俄罗斯联邦各地区科技指标》。 数据来源:OECD《科学技术指标1999/1》;《俄罗斯联邦各地区科技指标》。
Source: Main S&T Indicators of OECD 1999/1 Russian Federation, S&T in the Regions of the Russian Federation.
|
2 -6
|
部分国家R&D人员
R&D personnel in selected countries |
|
|
|
|
| |
R&D人员(全时工作当量,千人年)
R&D personnel (1000 FTEs) |
每万个劳动力中R&D人员(人年)
R&D personnel per 10000 labor force (FTE) |
|
中国 China 1998 |
755.2 |
11 |
|
日本 Japan 1997 |
894.0 |
125 |
|
德国 Germany 1995 |
459.1 |
116 |
|
法国 France 1996 |
320.8 |
125 |
|
英国 UK 1993 |
270.0 |
95 |
|
俄罗斯 Russia 1996 |
990.7 |
136 |
|
韩国 ROK 1997 |
136.6 |
63 |
数据来源:同表2-5。
Source: Same as Table 2-5.
|
|
| |
 |
|