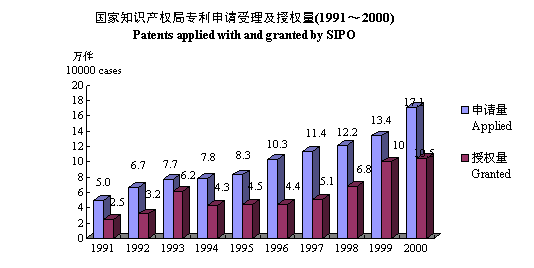
4-1 国家知识产权局专利申请受理量及授权量(1999~2000)
Number of patents applied with and granted by SIPO*
| |
1999 |
2000 |
合计
Total |
国内
Domestic |
国外
Foreign |
合计
Total |
国内
Domestic |
国外
Foreign |
| 申请量 Applied |
134239 |
109958 |
24281 |
170862 |
140339 |
30343 |
| 发明 Invention |
36694 |
15596 |
21098 |
51747 |
25346 |
26401 |
| 实用新型 Utility model |
57492 |
57214 |
278 |
68815 |
64861 |
354 |
| 外观设计 Design |
40053 |
37148 |
2905 |
50120 |
46532 |
3588 |
| 授权量 Granted |
100156 |
92101 |
8055 |
105345 |
95236 |
10109 |
| 发明 Invention |
7637 |
3097 |
4540 |
12683 |
6177 |
6506 |
| 实用新型 Utility model |
56368 |
56094 |
274 |
54743 |
54407 |
336 |
| 外观设计 Design |
36151 |
32910 |
3241 |
37919 |
34652 |
3267 |
*SIPO - State Intellectual Property Office of the People's Republic of china.

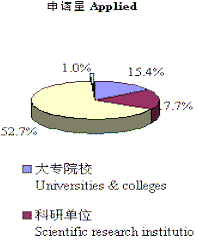
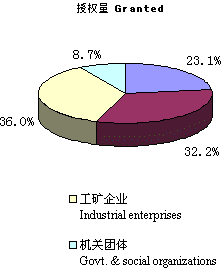
4-2 国家知识产权局受理和批准的国内职务发明专利按部门分布(1997~2000)
Domestic service invention patents applied with and granted by CPO by sector
| |
申请量 Applied |
授权量 Granted |
| 1997 |
1998 |
1999 |
2000 |
1997 |
1998 |
1999 |
2000 |
合计
Total |
4248 |
4618 |
6009 |
12609 |
912 |
954 |
1685 |
2824 |
大专院校
Universities & colleges |
635 |
794 |
988 |
1942 |
256 |
243 |
425 |
652 |
科研单位
Scientific research institutions |
1262 |
1248 |
1413 |
2228 |
316 |
337 |
543 |
910 |
工矿企业
Enterprises |
2239 |
2480 |
3490 |
8316 |
170 |
182 |
462 |
1016 |
机关团体
Govt. & social organizations |
112 |
96 |
118 |
123 |
170 |
192 |
255 |
246 |
国内职务发明专利按部门分布(2000)
Domestic service invention patents applied with and granted by CPO by sector


4-3 部分国家发明专利授权量(1998)
Invention patents granted in selected countries
| |
中国
China |
日本
Japan |
美国
US |
德国
Germany |
法国
French |
英国
UK |
俄罗斯
Russia |
韩国
South Korea |
墨西哥
Mexico |
本国人
Domestic |
1655 |
80292 |
125704 |
39500 |
19271 |
12068 |
4838 |
19215 |
141 |
外国人
Foreign |
3078 |
67228 |
15744 |
16990 |
32414 |
34145 |
38343 |
4100 |
3078 |
合计
Total |
4733 |
147520 |
141448 |
52890 |
51685 |
46213 |
43181 |
23315 |
3219 |
位次
Rank |
22 |
1 |
2 |
3 |
4 |
5 |
6 |
8 |
26 |
数据来源:世界知识产权组织工业产权统计(1998)。
Source:WIPO,Industrial Property Statistics (1997).
4-4 全国科技论文发表数(1996~2000)
National S&T publications
| |
1996 |
1997 |
1998 |
1999 |
2000 |
在国内刊物上发表的论文数*
in domestic journals |
116778 |
120851 |
133958 |
161692 |
180848 |
三系统收录我国的科技论文数
Catalogued by SCI、ISTP and EI |
27569 |
35311 |
35003 |
46188 |
49678 |
* 在国内刊物上发表的论文篇数是根据1300余种国内科技刊物上发表的论文统计的。
The data of domestic publications are based on about 1300 journals of China.
4-5 三系统和科学引文索引收录的部分国家科技论文数(2000)
S&T papers of selected countries catalogued by SCI, EI and ISTP as a whole and SCI
国别
country |
三系统 SCI,ISTP & EI |
科学引文索引SCI |
论文篇数
Papers |
% |
位次
Rank |
论文篇数
Papers |
% |
位次
Rank |
| 世界合计 Total |
1399776 |
100 |
|
967663 |
100 |
|
| 中国 China |
49678 |
3.55 |
8 |
30499 |
3.15 |
8 |
| 美国 USA |
417089 |
29.80 |
1 |
305616 |
31.58 |
1 |
| 日本 Japan |
123458 |
8.82 |
2 |
78942 |
8.16 |
3 |
| 英国 UK |
115051 |
8.22 |
3 |
88678 |
9.16 |
2 |
| 德国 Germany |
105320 |
7.52 |
4 |
75324 |
7.78 |
4 |
| 法国 French |
73804 |
5.27 |
5 |
53469 |
5.53 |
5 |
| 加拿大 Canada |
50946 |
3.64 |
7 |
37867 |
3.91 |
6 |
| 意大利 Italy |
51296 |
3.66 |
6 |
36482 |
3.77 |
7 |
| 俄罗斯 Russia |
39595 |
2.83 |
9 |
29099 |
3.01 |
9 |
| 印度 India |
24235 |
1.73 |
13 |
17502 |
1.81 |
10 |
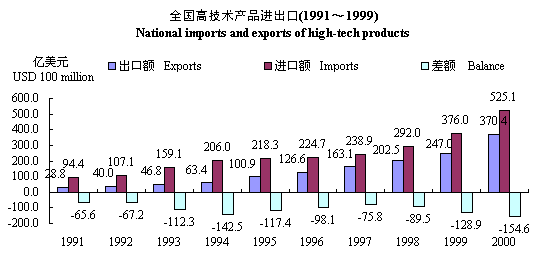
4-6 全国高技术产品进出口(1993~1999)
National imports and exports of high-tech products
| |
1996 |
1997 |
1998 |
1999 |
2000 |
高技术产品出口额
Exports of high-tech products |
122.6 |
163.1 |
202.5 |
247.0 |
370.4 |
占商品出口总额的比重(%)
Share in total exports |
8.4 |
8.9 |
11.0 |
12.7 |
14.9 |
占工业制成品出口额的比重
Share in industrial manufactured exports |
9.8 |
10.3 |
12.4 |
14.1 |
16.6 |
高技术产品进口额
Imports of high-tech products |
224.7 |
238.9 |
292.0 |
376.0 |
525.1 |
占商品进口总额的比重
Share in total imports |
16.2 |
16.8 |
20.8 |
22.7 |
23.3 |
占工业制成品进口额的比重
Share in industrial manufactured imports |
19.8 |
21.0 |
24.9 |
27.1 |
29.4 |

4-7 全国高技术产品进出口按领域分布(2000)
National imports and exports of high-tech products by field
| |
出口
Exports |
进口
Imports |
差额
Balance |
| 合计Total |
370.43 |
525.07 |
-154.64 |
| 计算机与通信技术 Computers and telecommunications |
270.09 |
206.46 |
63.62 |
| 生命科学技术 Life sciences |
13.75 |
16.51 |
-2.76 |
| 电子技术 Electronics |
58.45 |
193.25 |
-134.80 |
| 计算机集成制造技术 Computer integrated manufacturing |
4.99 |
55.56 |
-50.57 |
| 航空航天技术 Aerospace |
6.91 |
26.53 |
-19.61 |
| 光电技术 Opto-electronics |
9.84 |
9.32 |
0.53 |
| 生物技术 Biotechnology |
1.28 |
0.59 |
0.69 |
| 材料技术 Materials design |
3.17 |
7.90 |
-4.73 |
| 其他技术 Other technologies |
1.96 |
8.96 |
-7.00 |
4-8 全国各地区高技产品进出口情况(2000)
National imports and exports of high-tech products by region
地区
Region |
出口
Exports |
进口
Imports |
差额
Balance |
地区
Region |
出口
Exports |
进口
Imports |
差额
Balance |
| 北京 Beijing |
2276 |
9409 |
-7133 |
上海 Shanghai |
4808 |
8493 |
-3685 |
| 天津 Tianjin |
2149 |
2801 |
-652 |
江苏 Jiangsu |
5350 |
5648 |
-298 |
| 河北 Hebei |
54 |
134 |
-79 |
浙江 Zhejiang |
654 |
1374 |
-720 |
| 山西 Shanxi |
4 |
26 |
-21 |
安徽 Anhui |
60 |
129 |
-69 |
| 内蒙古 Inner Mongolia |
1 |
28 |
-27 |
福建 Fujian |
1652 |
1672 |
-20 |
| 辽宁 Liaoning |
1643 |
1397 |
246 |
江西 Jiangxi |
18 |
31 |
-13 |
| 吉林 Jilin |
18 |
101 |
-83 |
山东 Shandong |
650 |
1069 |
-420 |
| 黑龙江 Heilongjiang |
77 |
151 |
-75 |
河南 Henan |
20 |
66 |
-46 |
续4-8(continued from 4-8)
地区
Region |
出口
Exports |
进口
Imports |
差额
Balance |
地区
Region |
出口
Exports |
进口
Imports |
差额
Balance |
| 湖北 Hubei |
135 |
240 |
-105 |
云南 Yunnan |
48 |
61 |
-13 |
| 湖南 Hunan |
46 |
226 |
-181 |
西藏 Tibet |
4 |
2 |
2 |
| 广东 Guangdong |
17020 |
18315 |
-1296 |
陕西 Shaanxi |
68 |
347 |
-279 |
| 广西 Guanxi |
15 |
76 |
-61 |
甘肃 Gansu |
10 |
13 |
-3 |
| 海南 Hainan |
19 |
83 |
-64 |
青海 Qinghai |
0 |
2 |
-2 |
| 重庆 Chongqing |
30 |
74 |
-44 |
宁夏 Ningxia |
1 |
8 |
-7 |
| 四川 Sichuan |
206 |
472 |
-266 |
新疆 Xinjiang |
3 |
43 |
-40 |
| 贵州 Guizhou |
4 |
14 |
-11 |
|
|
|

