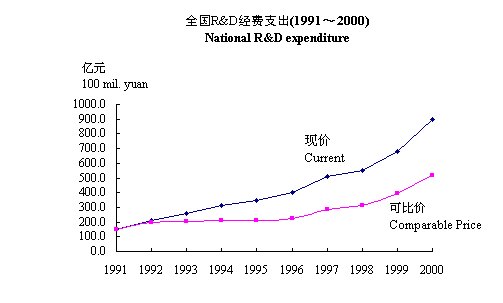
2-1 全国R&D经费支出(1996~2000)
National R&D expenditure
| |
1996 |
1997 |
1998 |
1999 |
2000 |
R&D经费支出
GERD |
404.5 |
509.2 |
551.1 |
678.9 |
896.0 |
比上年实际增长(%)*
Real annual growth (%) |
9.5 |
24.9 |
10.9 |
20.3** |
16.9** |
R&D经费支出/国内生产总值(%)
GERD/GDP(%) |
0.60 |
0.64 |
0.69 |
0.83 |
1.00 |
*按GDP的缩减指数计算 Calculated by GDP deflator
**按可比口径与GDP的缩减指数计算 Calculated on a comparable basis and Calculated by GDP deflator

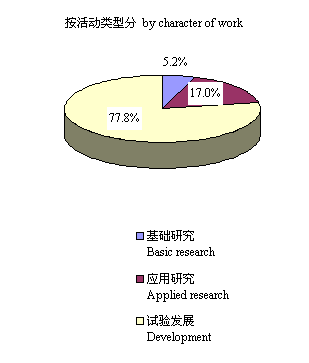
2-2 全国R&D经费支出按执行部门和活动类型分类(2000)
National R&D expenditure by sector of performance and character of work


2-3 全国R&D经费支出按行业分类(2000)
National R&D expenditure by industrious
| |
R&D经费支出(亿元)
R&D expenditure
(100 million yuan) |
R&D经费支出(%)
R&D expenditure
(%) |
全国
Total |
896.0 |
100 |
农、林、牧、渔及服务业
Agriculture, Forestry, Animal Husbandry and Fishery |
7.7 |
0.9 |
工业
Industrial Activities |
490.0 |
54.7 |
建筑业
Construction |
5.3 |
0.6 |
地质勘察、水利管理业
Geological Prospecting and Water Conservancy |
5.0 |
0.6 |
交通运输、仓储及邮电通信业
Transport, Storage, Post and Telecommunication Services |
9.7 |
1.0 |
计算机应用服务业
Computer and Related Activities |
14.0 |
1.6 |
卫生业
Health |
12.0 |
1.3 |
教育
Education |
73.6 |
8.2 |
科学研究业
Research and Development |
258.2 |
28.8 |
综合技术服务业及其他
Comprehensive Technology Services and Others |
20.5 |
2.3 |
注:数据来源于2000年全国R&D资源清查主要数据统计公报。
Note: Data origin statistical communiqué on the 2000 national census of research and experimental development resources
2-4 全国R&D经费支出按地域分类(2000)
National R&D expenditure by Region
| 地区Region |
R&D经费支出
R&D expenditure |
地区Region |
R&D经费支出
R&D expenditure |
| 合计 Total |
896.0 |
|
|
| 北京 Beijing |
155.7 |
上海 Shanghai |
73.8 |
| 天津 Tianjin |
24.7 |
江苏 Jiangsu |
73.1 |
| 河北 Hebei |
26.3 |
浙江 Zhejiang |
33.4 |
| 山西 Shanxi |
9.9 |
安徽 Anhui |
20.0 |
| 内蒙古 Inner Mongolia |
3.3 |
福建 Fujian |
21.2 |
| 辽宁 Liaoning |
41.7 |
江西 Jiangxi |
8.2 |
| 吉林 Jilin |
13.4 |
山东 Shandong |
52.0 |
| 黑龙江 Heilongjiang |
14.9 |
河南 Henan |
24.8 |
续2-4(continued from 2-4)
| 地区Region |
R&D经费支出
R&D expenditure |
地区Region |
R&D经费支出
R&D expenditure |
| 湖北 Hubei |
34.8 |
云南 Yunnan |
6.8 |
| 湖南 Hunan |
19.2 |
西藏 Tibet |
0.2 |
| 广东 Guangdong |
107.1 |
陕西 Shaanxi |
49.5 |
| 广西 Guangxi |
8.4 |
甘肃 Gansu |
7.3 |
| 海南 Hainan |
0.8 |
青海 Qinghai |
1.3 |
| 重庆 Chongqing |
10.1 |
宁夏 Ningxia |
1.7 |
| 四川 Sichuan |
44.9 |
新疆 Xinjiang |
3.2 |
| 贵州 Guizhou |
4.2 |
|
|
2-5 部分国家R&D经费支出
R&D expenditure in selected countries
| |
中国
China
2000 |
美国
USA
1999 |
日本
Japan
1998 |
德国
Germany
1998 |
法国
France
1997 |
英国
UK
1998 |
俄罗斯
Russia
1997 |
韩国
ROK
1999 |
印度
India
1999 |
R&D经费
GERD |
896 |
2470 |
1301 |
501 |
327 |
147 |
481 |
91 |
35 |
| GERD/GDP(%) |
1.00 |
2.79 |
2.83 |
2.33 |
2.23 |
1.8 |
0.94 |
2.83 |
0.86 |
货币单位:中国为亿元人民币,英国为亿英镑,其他各国为亿美元。
Currency: data on China in 100 million yuan, UK in 100 million pounds, others in US$ 100 million.
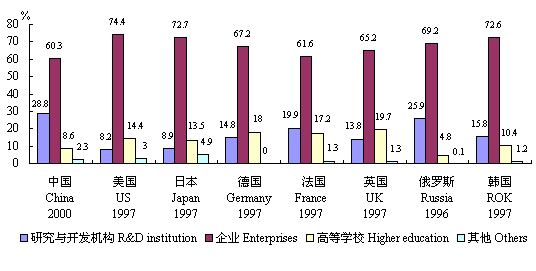
2-6 部分国家R&D经费支出按执行部门分类
R&D expenditure in selected countries by sector of performance

数据来源:除中国数据外,其他数据取自OECD《主要科学技术指标1999/1》和《俄罗斯联邦各地区科技指标》。
Source: Main S&T Indicators of OECD 1999/1 and Russian Federation, S&T in the Regions of the Russian Federation, except the data on China.

