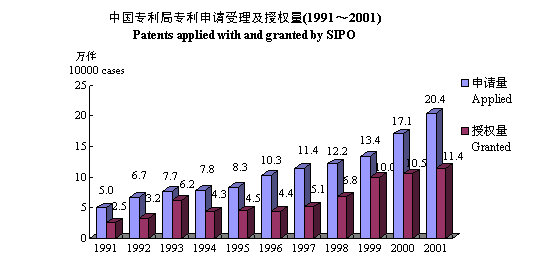
4-1 国家知识产权局专利申请受理量及授权量(2000~2001)
Number of patents applied with and granted by SIPO*
| |
2000 |
2001 |
合计
Total |
国内
Domestic |
国外
Foreign |
合计
Total |
国内
Domestic |
国外
Foreign |
| 申请量 Applied |
170682 |
140339 |
30343 |
203573 |
165773 |
37800 |
| 发明 Invention |
51747 |
25346 |
26401 |
63204 |
30038 |
33166 |
| 实用新型 Utility model |
68815 |
68461 |
354 |
79722 |
79275 |
447 |
| 外观设计 Design |
50120 |
46532 |
3588 |
60647 |
56460 |
4187 |
| 授权量 Granted |
105345 |
95236 |
10109 |
114251 |
99278 |
14973 |
| 发明 Invention |
12683 |
6177 |
6506 |
16296 |
5395 |
10901 |
| 实用新型 Utility model |
54743 |
54407 |
336 |
54359 |
54018 |
341 |
| 外观设计 Design |
37919 |
34652 |
3267 |
43596 |
39865 |
3731 |
*SIPO – State Intellectual Property Office of the People’s Republic of China.

4-2 国家知识产权局受理和批准的国内职务发明专利按部门分布(1998~2001)
Domestic service invention patents applied with and granted by SIPO by sector
| |
申请量 Applied |
授权量 Granted |
| 1998 |
1999 |
2000 |
2001 |
1998 |
1999 |
2000 |
2001 |
合计
Total |
4618 |
6009 |
12609 |
14815 |
954 |
1685 |
2824 |
2614 |
大专院校
Universities & colleges |
794 |
988 |
1942 |
2636 |
243 |
425 |
652 |
579 |
科研单位
Scientific research institutions |
1248 |
1413 |
2228 |
2659 |
337 |
543 |
910 |
800 |
工矿企业
Enterprises |
2480 |
3490 |
8316 |
9371 |
182 |
462 |
1016 |
1089 |
机关团体
Govt. & social organizations |
96 |
118 |
123 |
149 |
192 |
255 |
246 |
146 |
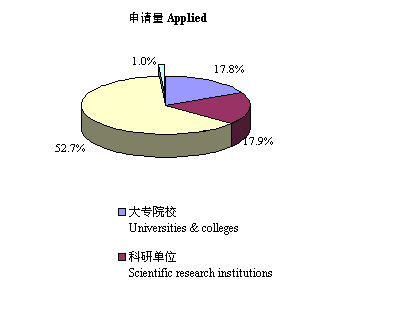
国内职务发明专利按部门分布(2001)
Domestic service invention patents applied with and granted by CPO by sector


4-3 部分国家发明专利授权量(2000)
Invention patents granted in selected countries
| |
中国
China |
美国
US |
日本
Japan |
德国
Germany |
法国
French |
韩国
South Korea |
英国
UK |
意大利
Italy |
俄罗斯
Russia |
本国人
Domestic |
6475 |
85071 |
112269 |
16901 |
10303 |
22943 |
4170 |
618 |
14444 |
外国人
Foreign |
6881 |
72425 |
13611 |
24684 |
26101 |
12013 |
29586 |
19034 |
3148 |
合计
Total |
13356 |
157496 |
125880 |
41585 |
36404 |
34956 |
33756 |
19652 |
17592 |
合计位次
Rank |
13 |
1 |
2 |
3 |
4 |
5 |
6 |
7 |
8 |
数据来源:世界知识产权组织工业产权统计(2000)。
Source:WIPO,Industrial Property Statistics (2000).
4-4 全国科技论文发表数(1996~2001)
National S&T publications
| |
1996 |
1997 |
1998 |
1999 |
2000 |
2001 |
在国内科技刊物上发表的论文数
In domestic journals |
116239 |
120851 |
133341 |
162779 |
180848 |
203229 |
三系统收录我国的科技论文数
Catalogued by SCI、ISTP and EI |
27569 |
35311 |
35003 |
46188 |
49678 |
64526 |
4-5 三系统和科学引文索引收录的部分国家科技论文数(2001)
S&T papers of selected countries catalogued by SCI, EI and ISTP as a whole and SCI
国别
country |
三系统 SCI,ISTP & EI |
SCI |
论文篇数
Papers |
% |
位次
Rank |
论文篇数
Papers |
% |
位次
Rank |
| 世界合计 Total |
1472280 |
100 |
|
999621 |
100 |
|
| 中国 China |
64526 |
4.38 |
6 |
35685 |
3.57 |
8 |
| 美国 USA |
445651 |
30.27 |
1 |
327199 |
32.73 |
1 |
| 日本 Japan |
131592 |
8.94 |
2 |
83025 |
8.31 |
3 |
| 英国 UK |
119815 |
8.14 |
3 |
93275 |
9.33 |
2 |
| 德国 Germany |
110887 |
7.53 |
4 |
79002 |
7.9 |
4 |
| 法国 French |
77223 |
5.25 |
5 |
55340 |
5.54 |
5 |
| 意大利 Italy |
56269 |
3.82 |
7 |
39185 |
3.92 |
6 |
| 加拿大 Canada |
52006 |
3.53 |
8 |
39116 |
3.91 |
7 |
| 俄罗斯 Russia |
37290 |
2.53 |
9 |
26516 |
2.65 |
10 |
| 印度 India |
26257 |
1.78 |
14 |
19338 |
1.93 |
13 |
4-6 全国高技术产品进出口(1996~2001)
National imports and exports of high-tech products
| |
1996 |
1997 |
1998 |
1999 |
2000 |
2001 |
高新技术产品出口额
Exports of high-tech products |
126.6 |
163.1 |
202.5 |
247.0 |
370.4 |
464.5 |
占商品出口总额的比重(%)
Share in total exports |
8.4 |
8.9 |
11.0 |
12.7 |
14.9 |
17.5 |
占工业制成品出口额的比重
Share in industrial manufactured exports |
9.8 |
10.3 |
12.4 |
14.1 |
16.6 |
19.4 |
高新技术产品进口额
Imports of high-tech products |
224.7 |
238.9 |
292.0 |
376.0 |
525.1 |
641.1 |
占商品进口总额的比重
Share in total imports |
16.2 |
16.8 |
20.8 |
22.7 |
23.3 |
26.3 |
占工业制成品进口额的比重
Share in industrial manufactured imports |
19.8 |
21.0 |
24.9 |
27.1 |
29.4 |
32.4 |

4-7 全国高技术产品进出口按领域分布(2001)
National imports and exports of high-tech products by field
| |
出口
Exports |
进口
Imports |
差额
Balance |
合计
Total |
464.52 |
641.07 |
-176.55 |
计算机与通信技术
Computers and telecommunications |
362.21 |
235.79 |
126.42 |
生命科学技术
Life sciences |
16.88 |
22.31 |
-5.43 |
电子技术
Electronics |
55.62 |
232.74 |
-177.11 |
计算机集成制造技术
Computer integrated manufacturing |
5.98 |
66.35 |
-60.37 |
航空航天技术
Aerospace |
6.24 |
52.04 |
-45.80 |
光电技术
Opto-electronics |
11.08 |
12.19 |
-1.11 |
生物技术
Biotechnology |
1.66 |
0.66 |
1.00 |
材料技术
Materials design |
2.96 |
14.10 |
-11.14 |
其他技术
Other technologies |
1.89 |
4.90 |
-3.01 |
4-8 全国各地区高技产品进出口情况(2001)
National imports and exports of high-tech products by region
地区
Region |
出口
Exports |
进口
Imports |
差额
Balance |
地区
Region |
出口
Exports |
进口
Imports |
差额
Balance |
| 北京 Beijing |
2438 |
9440 |
-7002 |
上海 Shanghai |
5406 |
10534 |
-5127 |
| 天津 Tianjin |
2778 |
2734 |
43 |
江苏 Jiangsu |
7277 |
7063 |
215 |
| 河北 Hebei |
56 |
186 |
-130 |
浙江 Zhejiang |
979 |
2042 |
-1063 |
| 山西 Shanxi |
5 |
70 |
-65 |
安徽 Anhui |
65 |
162 |
-98 |
| 内蒙古 Inner Mongolia |
1 |
35 |
-33 |
福建 Fujian |
1760 |
1741 |
19 |
| 辽宁 Liaoning |
1753 |
2071 |
-318 |
江西 Jiangxi |
45 |
79 |
-34 |
| 吉林 Jilin |
17 |
174 |
-156 |
山东 Shandong |
778 |
1729 |
-951 |
| 黑龙江 Heilongjiang |
76 |
229 |
-153 |
河南 Henan |
25 |
135 |
-109 |
续4-8(continued from 4-8)
地区
Region |
出口
Exports |
进口
Imports |
差额
Balance |
地区
Region |
出口
Exports |
进口
Imports |
差额
Balance |
| 湖北 Hubei |
143 |
526 |
-383 |
云南 Yunnan |
62 |
217 |
-156 |
| 湖南 Hunan |
41 |
187 |
-146 |
西藏 Tibet |
7 |
1 |
6 |
| 广东 Guangdong |
22288 |
22191 |
98 |
陕西 Shaanxi |
129 |
430 |
-301 |
| 广西 Guanxi |
13 |
75 |
-62 |
甘肃 Gansu |
6 |
28 |
-22 |
| 海南 Hainan |
21 |
473 |
-452 |
青海 Qinghai |
0 |
10 |
-9 |
| 重庆 Chongqing |
25 |
80 |
-55 |
宁夏 Ningxia |
3 |
22 |
-19 |
| 四川 Sichuan |
245 |
1004 |
-760 |
新疆 Xinjiang |
8 |
389 |
-382 |
| 贵州 Guizhou |
3 |
51 |
-48 |
|
|
|
|

