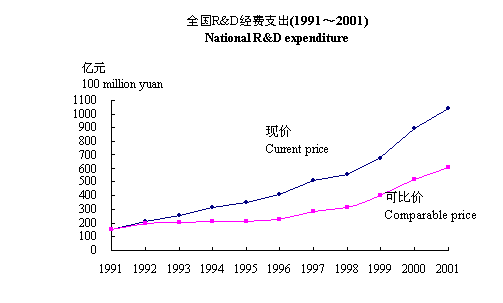
2-1 全国R&D经费支出(1996~2001)
National R&D expenditure
| |
1996 |
1997 |
1998 |
1999 |
2000 |
2001 |
R&D经费支出
GERD |
404.5 |
509.2 |
551.1 |
678.9 |
895.7 |
1042.5 |
比上年实际增长(%)*
Real annual growth (%) |
9.5 |
24.9 |
10.9 |
20.3** |
16.9** |
16.4 |
R&D经费支出/国内生产总值(%)
GERD/GDP(%) |
0.60 |
0.64 |
0.69 |
0.83 |
1.01 |
1.09 |
*按GDP的缩减指数计算 Calculated by GDP deflator
**按可比口径与GDP的缩减指数计算 Calculated on a comparable basis and Calculated by GDP deflator
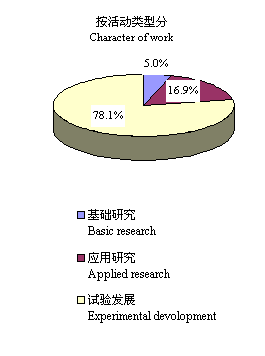
2-2 全国R&D经费支出按执行部门和活动类型分类(2001)
National R&D expenditure by sector of performance and character of work

2-3 全国R&D经费支出按资金来源分类*(2000)
National R&D expenditure by source of funding
| 执行部门 |
全国
Total |
研究与开发机构
R&D institutions |
企业
Enterprises |
高等学校
Higher education |
其他
Others |
合计
Total |
100.0 |
100.0 |
100.0 |
100.0 |
100.0 |
政府资金
Government funds |
33.4 |
81.4 |
6.9 |
58.5 |
30.9 |
企业资金
Enterprise funds |
57.6 |
5.2 |
86.4 |
32.3 |
57.2 |
国外资金
Oversea funds |
2.7 |
0.7 |
4.0 |
1.2 |
0.4 |
其他资金
Other funds |
6.3 |
12.7 |
2.8 |
8.0 |
11.4 |
* 部分数据由科技部推算。
Part of data concluded by MOST.
2-4 全国R&D经费支出按行业分类(2000)
National R&D expenditure by industrious
| |
R&D经费支出(亿元)
R&D expenditure
(100 million yuan) |
R&D经费支出(%)
R&D expenditure
(%) |
全国
Total |
896.0 |
100 |
农、林、牧、渔及服务业
Agriculture,Forestry,Animal Husbandry and Fishery |
7.7 |
0.9 |
工业
Industrial Activities |
490.0 |
54.7 |
建筑业
Construction |
5.3 |
0.6 |
地质勘察、水利管理业
Geological Prospecting and Water Conservancy |
5.0 |
0.6 |
交通运输、仓储及邮电通信业
Transport,Storage,Post and Telecommunication Services |
9.7 |
1.0 |
计算机应用服务业
Computer and Related Activities |
14.0 |
1.6 |
卫生业
Health |
12.0 |
1.3 |
教育
Education |
73.6 |
8.2 |
科学研究业
Research and Development |
258.2 |
28.8 |
综合技术服务业及其他
Comprehensive Technology Services and Others |
20.5 |
2.3 |
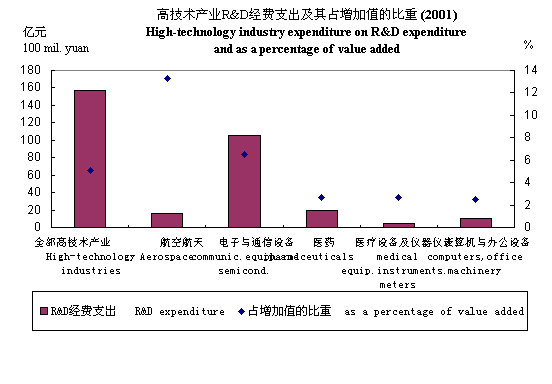
2-5 高技术产业R&D经费支出及其占增加值的比重(2001)
High-technology industry expenditure on R&D and
as a percentage of value added
| |
R&D经费支出(亿元)
R&D expenditure
(100 million yuan) |
占增加值的比重(%)
as a percentage of value added
(%) |
全部高技术产业
High-technology industries |
157.0 |
5.07 |
航空航天制造业
Aerospace |
16.5 |
13.32 |
计算机与办公设备制造业
Computers,office equipments |
10.7 |
2.48 |
电子与通信设备制造业
Electronic and telecommunications |
105.4 |
6.49 |
医疗设备及仪器仪表制造业
Medical equipments and meters |
5.1 |
2.66 |
医药制造业
Pharmaceuticals |
19.3 |
2.67 |
2-6 全国R&D经费支出按地域分类(2001)
National R&D expenditure by region
地区
Region |
R&D经费支出
R&D expenditure |
地区
Region |
R&D经费支出
R&D expenditure |
| 合计 Total |
1042.49 |
|
| 北京 Beijing |
171.17 |
上海 Shanghai |
88.08 |
| 天津 Tianjin |
25.16 |
江苏 Jiangsu |
92.27 |
| 河北 Hebei |
25.75 |
浙江 Zhejiang |
41.41 |
| 山西 Shanxi |
10.82 |
安徽 Anhui |
21.05 |
| 内蒙古 Inner Mongolia |
3.88 |
福建 Fujian |
22.62 |
| 辽宁 Liaoning |
53.90 |
江西 Jiangxi |
7.76 |
| 吉林 Jilin |
16.54 |
山东 Shandong |
60.93 |
| 黑龙江 Heilongjiang |
20.14 |
河南 Henan |
28.31 |
续2-6(continued from 2-6)
地区
Region |
R&D经费支出
R&D expenditure |
地区
Region |
R&D经费支出
R&D expenditure |
| 湖北 Hubei |
36.85 |
云南 Yunnan |
7.70 |
| 湖南 Hunan |
23.98 |
西藏 Tibet |
0.20 |
| 广东 Guangdong |
137.43 |
陕西 Shaanxi |
51.69 |
| 广西 Guangxi |
8.00 |
甘肃 Gansu |
8.38 |
| 海南 Hainan |
0.85 |
青海 Qinghai |
1.17 |
| 重庆 Chongqing |
9.99 |
宁夏 Ningxia |
1.53 |
| 四川 Sichuan |
57.47 |
新疆 Xinjiang |
3.21 |
| 贵州 Guizhou |
5.35 |
|
2-7 部分国家R&D经费支出
R&D expenditure in selected countries
| |
中国
China
2001 |
美国
USA
2000 |
日本
Japan
2000 |
德国
Germany
2000 |
法国
France
2000 |
英国
UK
2000 |
俄罗斯
Russia
2000 |
韩国
Korea
2000 |
巴西
Brazil
1999 |
印度
India
1999 |
R&D经费
GERD |
126 |
2653 |
1420 |
463 |
278 |
266 |
27 |
123 |
47 |
35 |
GERD/GDP
(%) |
1.09 |
2.69 |
2.98 |
2.48 |
2.15 |
1.86 |
1.09 |
2.68 |
0.87 |
0.86 |
数据来源:除中国、巴西和印度数据外,其他数据取自OECD《主要科学技术指标2002/1》。
Source: OECD, Main Science &Technology Indicators 2002/1, except the data on China, Brazil and India.
2-8 部分国家R&D经费支出按执行部门分类
R&D expenditure in selected countries by sector of performance
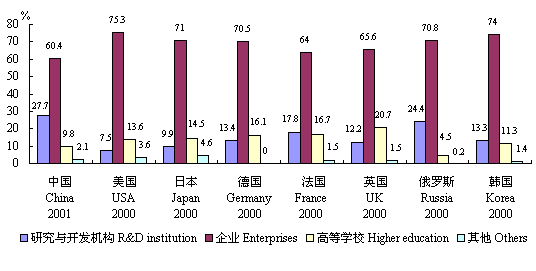
数据来源:除中国数据外,其他数据取自OECD《主要科学技术指标2002/1》。
Source: OECD, Main Science &Technology Indicators 2002/1, except the data on China.
2-9 部分国家R&D经费支出按活动类型分类
R&D expenditure in selected countries by character of work
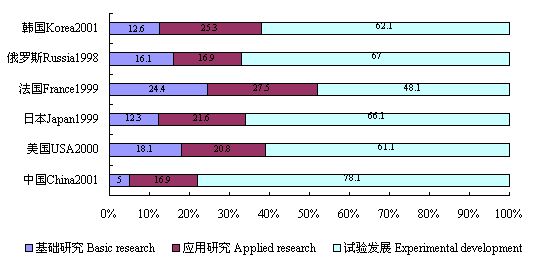
数据来源:除中国和韩国数据外,其他数据取自OECD《科学技术基础数据2001》。
Source: OECD, Basic Science & Technology Statistics 2001, except the data on China and Korea
2-10 部分国家R&D人力
R&D personnel in selected countries
| |
R&D人力(全时工作当量,千人年)
R&D personnel (1000 FTEs) |
每万个劳动力中R&D人力(人年)
R&D personnel per 10000 labor force (FTE) |
| 中国 China 2001 |
956.5 |
13 |
| 日本 Japan 2000 |
896.8 |
133 |
| 德国 Germany 2000 |
488.1 |
120 |
| 法国 France 1999 |
314.5 |
120 |
| 俄罗斯 Russia 2000 |
1007.3 |
140 |
| 韩国 Korea 2000 |
138.1 |
63 |
数据来源:同表2-7。
Source: Same as Table 2-7.

